

Buildersbuilder
Dashboard Designer
How do we put live operational KPIs in front of exactly the right seats?
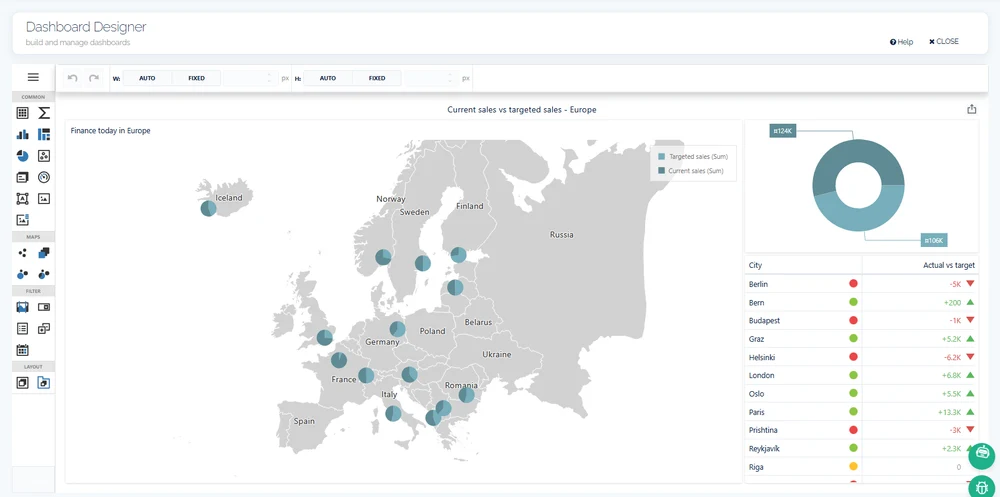
Compose dashboards of chart, table, and KPI widgets bound to saved queries or SQL, then grant them to the positions and partners who should see them. One dashboard definition can serve many contexts — parameterized per project, site, or period.
How it works
A dashboard is assembled from widgets — charts, tables, KPIs — each bound to a saved query from the shared data layer or to ad-hoc SQL where a widget needs it. The rendering is handled by a mature enterprise dashboard engine; continON supplies the binding and the governance around it.
Visibility follows the same model as everything else on the platform: dashboards are granted to positions in the org chart and to partners, so what a viewer sees is bounded by the seat they hold. Dashboards are also flagged and organized — built-in, global, or generated — so a growing set stays administrable.
Dashboards go where the work is. One can be embedded inside a form, and a definition can be parameterized by operational context — the same dashboard scoped per project in work management, per site, or per period — instead of cloning a copy for each one.
What it binds to
Dashboard Designer
Widgets on governed data
Chart, table, and KPI widgets bind to saved queries — or ad-hoc SQL where needed — from the shared catalog.
Position and partner grants
Each dashboard is granted to seats and partners, so visibility survives personnel changes without rework.
Embeddable in forms
A dashboard can render inside a form, putting live figures next to the work being decided.
Parameterized per context
One definition, many scopes: the same dashboard resolves per project, location, or period through its parameters.
What this touches
- Query & Data Source Builder
Widgets read from the saved-query catalog that feeds the whole platform. - Report Designer
Tabular reporting and dashboards share the same data layer and grant model. - Project Management
Per-project dashboards are this designer’s parameterization applied at project scope. - Organization & positions
Grants attach to positions-in-unit, so the org chart decides who sees which figures.
See dashboard designer running in continON.
A guided walkthrough on a sanitized demo tenant — this capability inside its module, on the shared platform.